
Mapping innovation ecosystems
Imagine travelling across an unknown landscape without any written or digital directions. You would need to rely on locals and guides who had been down the journey to help you avoid pitfalls and find the best path to get to your destination. A map in this situation would make travel more efficient and allow more people to get to their destination more reliably.
In the same way, an ecosystem map helps aspiring entrepreneurs realise their goals. They will still rely on past experience, personal networks, and mentors with previous experience in the region to guide them. However, a map encourages others to take the journey and helps seasoned travelers navigate a constantly changing landscape.
While over the centuries we have developed a standard for physical maps, we have not agreed on what an innovation ecosystem “looks” like. Similar to personality or culture, we can describe how an ecosystem feels, differences between ecosystems, how an ecosystem is expressed in terms of activities, and even measure ecosystem outcomes. But we are unable to physically “see” an ecosystem.
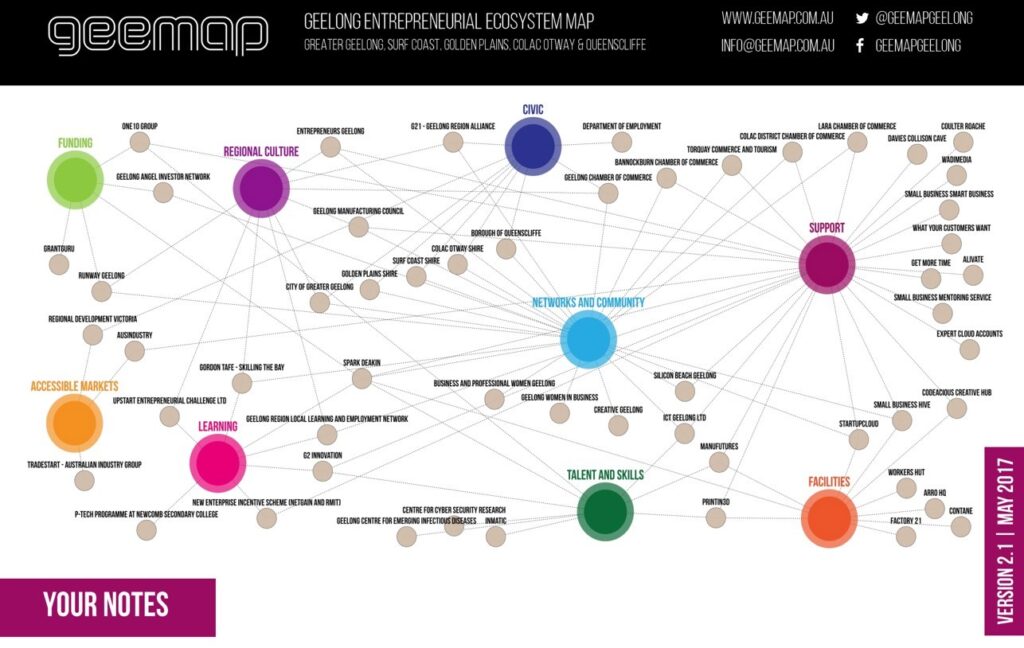
Like its biologic ecology namesake, maps of innovation ecosystems describe relationships between “species” in the system. These actors include entrepreneurs, investors, physical spaces, programs, government agencies, talent providers, research institutions, service providers, community agencies, and others involved in the entrepreneurial process in a given region.
It is also important to distinguish between a map and a directory. A directory lists actors, possibly within a region, usually focusing on one actor type. Ecosystem maps communicate: who’s who in the zoo, “you are here”, and guidance to get “there”.
For example, many instances of directories of co-working spaces exist, including: global coworking map, co-worker.com, Google maps, Share Desk, Find Work Spaces, Workfrom, Pivotdesk, Kowrk, Pickspace, Workspot, Coworking Switzerland, and New Worker New York co-working.
Ecosystem maps make visible a network of activity that often occurs below the surface. Innovation ecosystems are multifaceted, made up of actors from diverse specialisations, backgrounds and cultures without any formal ties to bind them together. Ecosystems are also complex, with dynamic variables governing interactions. These interactions form the fabric that binds ecosystems together through personal relationships.
My recent outline of physical innovation spaces across Queensland represented one facet of the broader ecosystem. My focus continues on towards a broader map of the innovation ecosystem for Queensland and beyond.
Constructs
A review of how others have represented ecosystems is helpful as we develop the ecosystem map for Queensland and collaborate with others across Australia and globally. Constructs that emerge from the review include:
Scope or Boundary
Map boundaries are usually based on a geographic region defined by political remit at the local, state, or national level. As local maps mature and become more sophisticated, global maps will emerge to make cross-border open innovation processes more effective.
Global maps help span boundaries. There is a natural tension between local innovation investment for regional economic outcomes and support for global scale. Maps that span geographic boundaries not only help a startup founder navigate, but also plot a path for their return trip as a mentor or investor.
“Species”
The primary objects in the map are the actors who make up the ecosystem. These actors are represented using conventions of map placement, colour, or supporting iconic representation. These conventions depict function (investor, space, university, etc.), stage of support (pre-revenue, MVP, validation, scale, etc.), and specialisation (sector, technology, impact, etc).
Relationships and flow
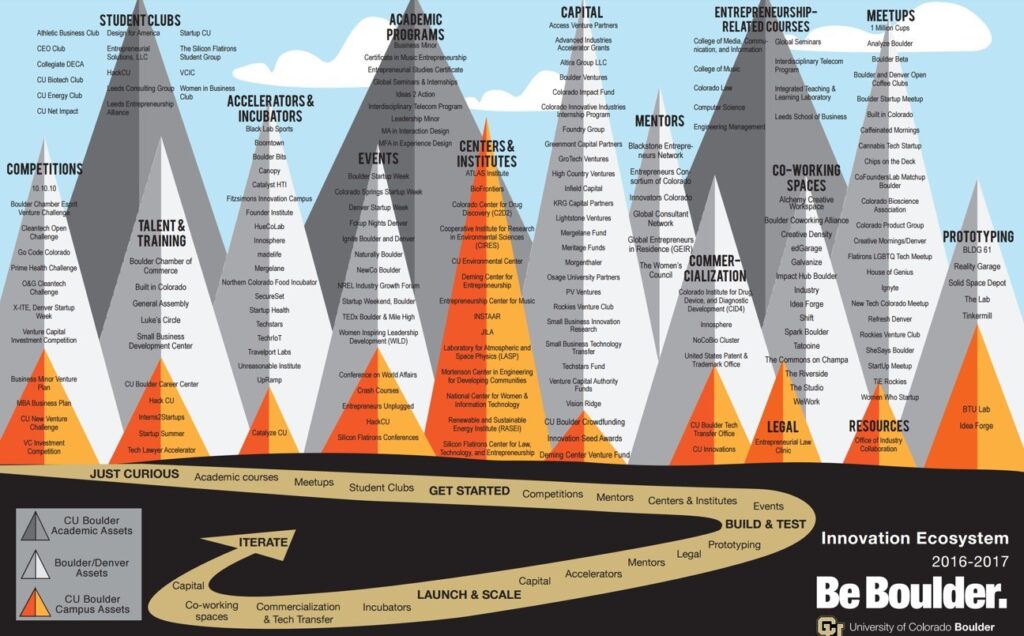
Some maps depict relationships between actors through metaphors such as a train line, mountain range, or circuit board. These relationships usually focus on stage of the founder, startup, or enterprise.
Time and sources
A final construct to consider is the recency of the map and who updates the map. A challenge with mapping ecosystems is that the landscape is constantly moving. If a map cannot be trusted because it is out of date, then it becomes irrelevant. This leads to either constant manual updating or a more dynamic digital platform. Manual updates by a central agency has limitations of potential bias and cost of maintenance, while dynamic user-generated content can be challenged to provide an incentive for self-maintenance of content.
Ecosystem map examples
The intent of this post is to capture my thoughts as I work towards a map of the Queensland ecosystem, identify and connect with others who are doing similar work globally, and as always get feedback on the overall thought process. The maps below have been identified through personal connections and Google searches.
Each map can be considered to the extent that it is easy to navigate, can be adapted to measurement, ease of updating and currency, completeness of data, ease of generalising to another region, size of region (City, State, Nation), and the map sponsor (community, government, university).
This is an ongoing body of work. Please let me know if there are other maps you are aware of that should be included.
Please also connect if you are working on a similar mapping exercise. I am keen to colaborate to more rapidly and efficiently achieve global outcomes for entrepreneurs.
- Ver 0.1 (13 Aug 17): Initial release
- Ver 0.2 (16 Aug 17): Add Blue Chilli Start Rail
- Ver 0.3 (20 Aug 17): Add St Louis
- ver 0.4 (24 Sep 17): Add Sunshine Coast, Qld, AU
- ver 0.5 (3 Nov 17): Add UNSW Startrail
Boulder, Colorado
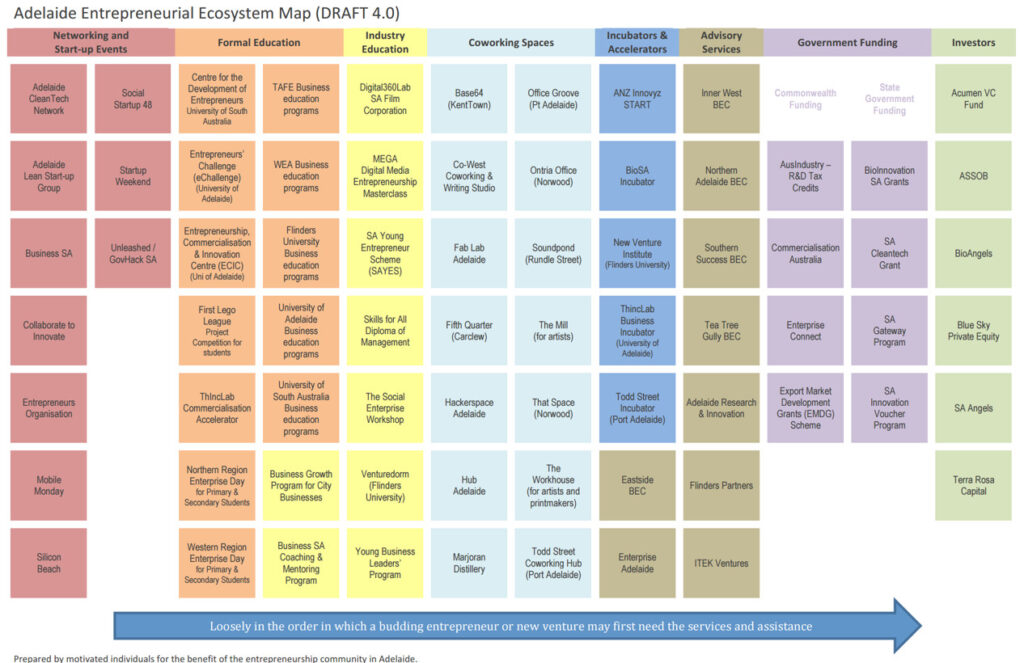
City of Adelaide
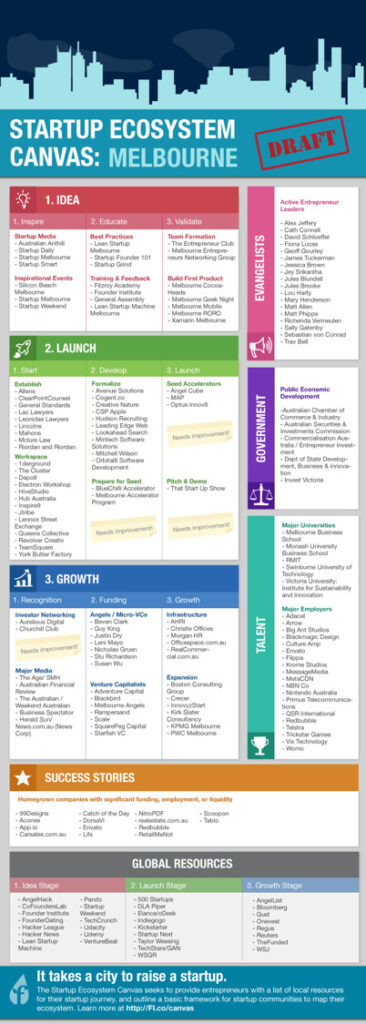
Startup Ecosystem Canvas (multiple, Melbourne example)
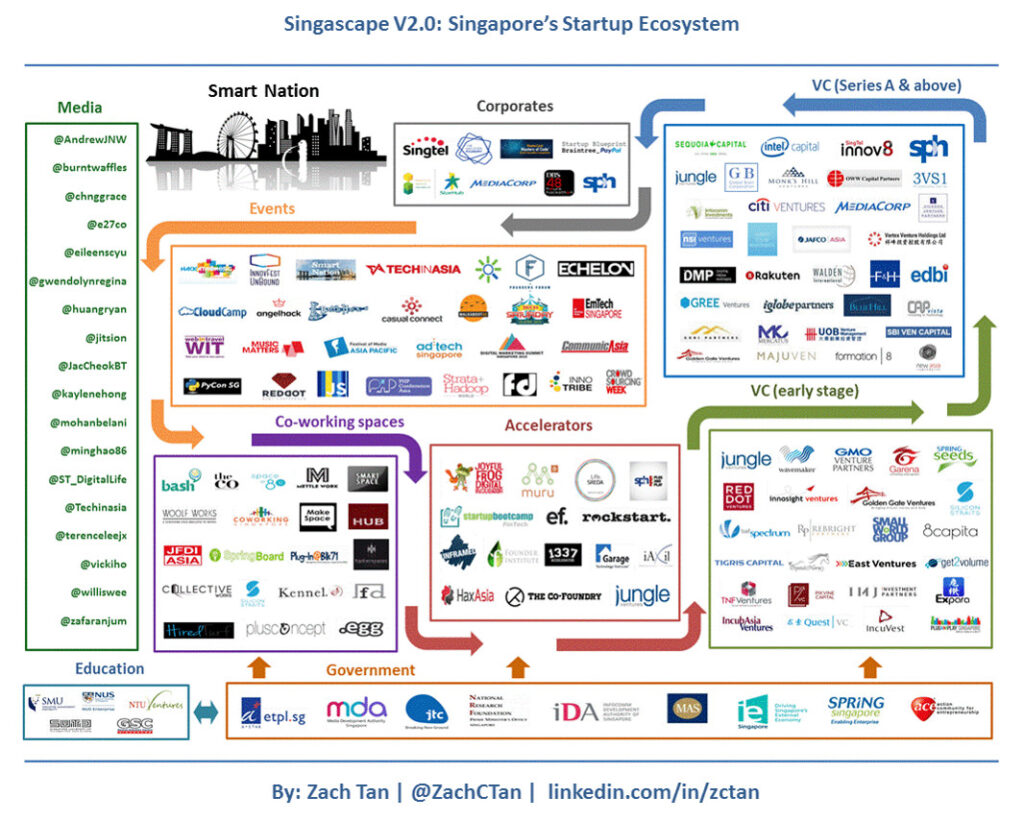
Singapore
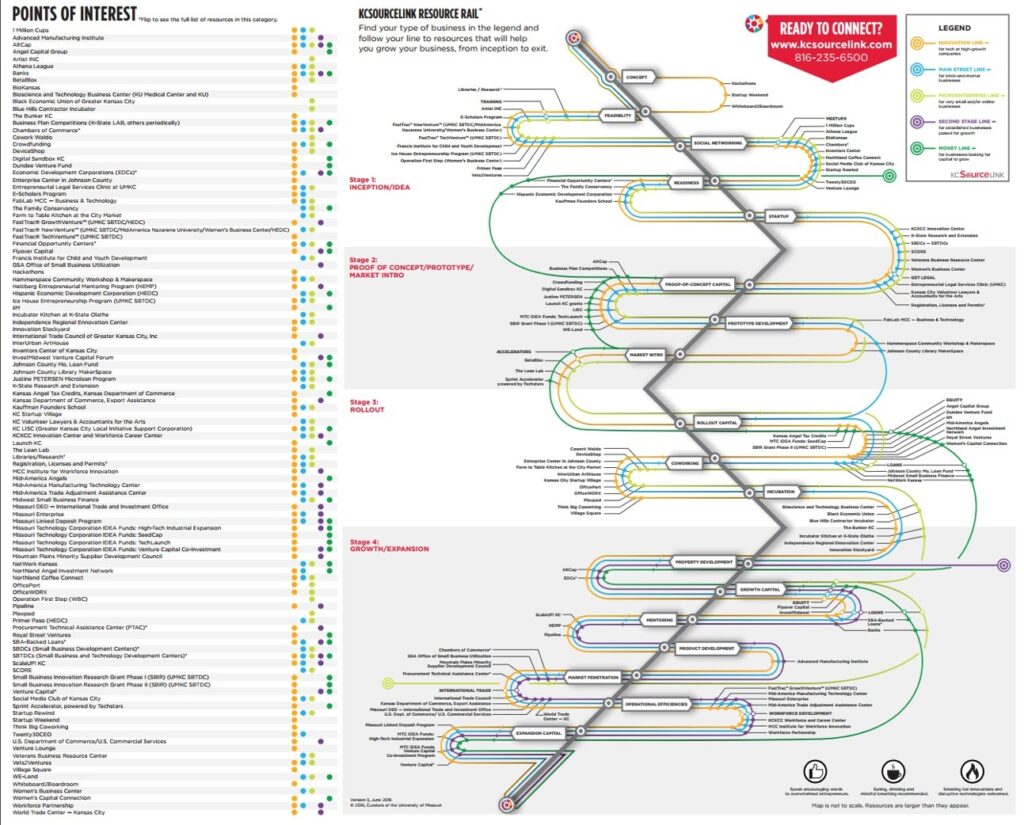
Kansas City (KC SourceLink)
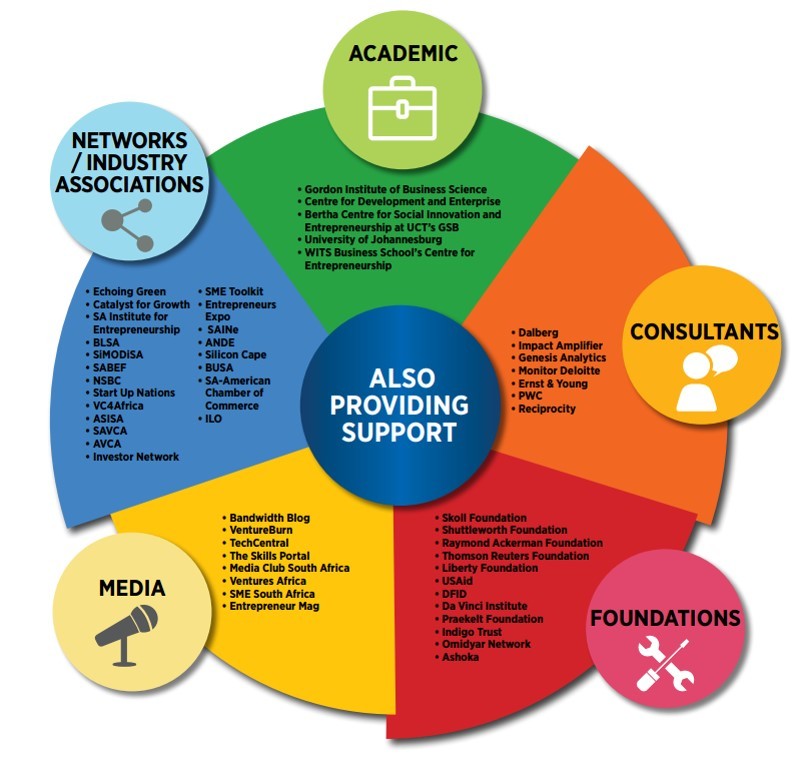
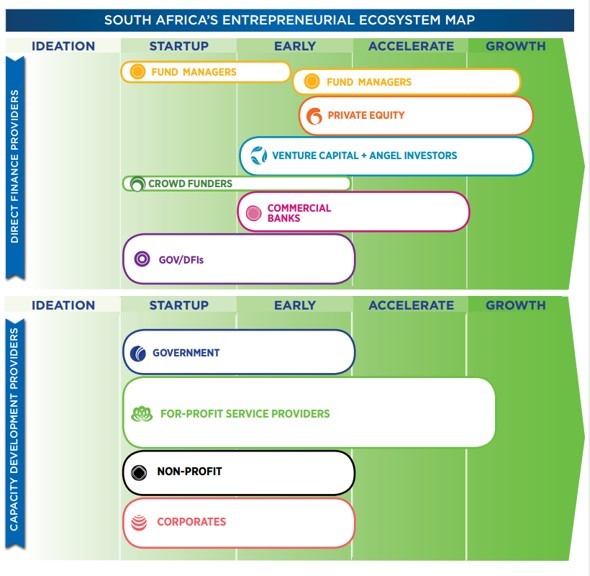
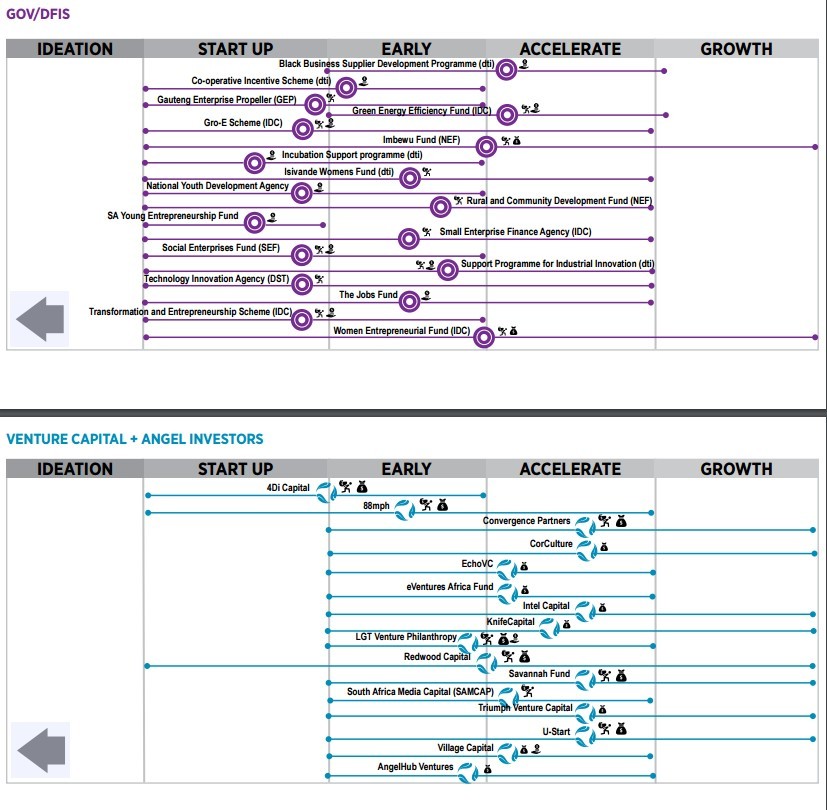
South Africa (Aspen Institute)
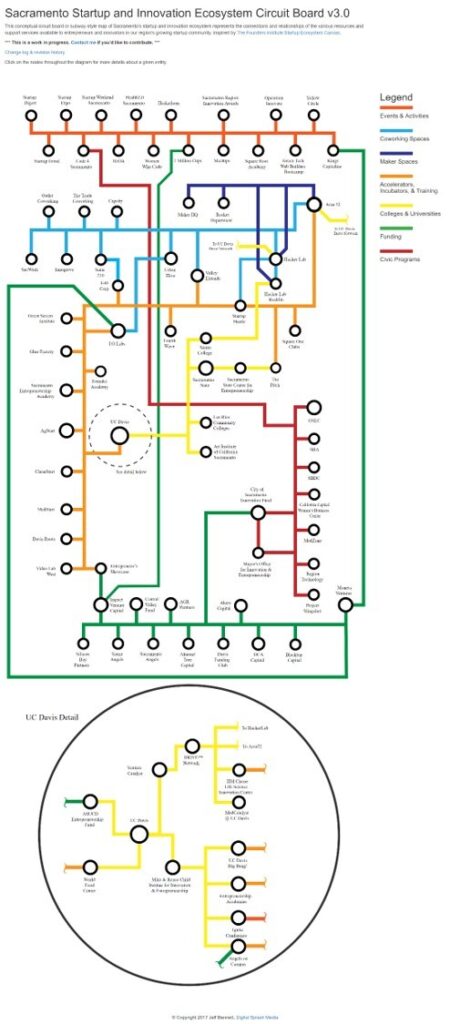
Sacramento
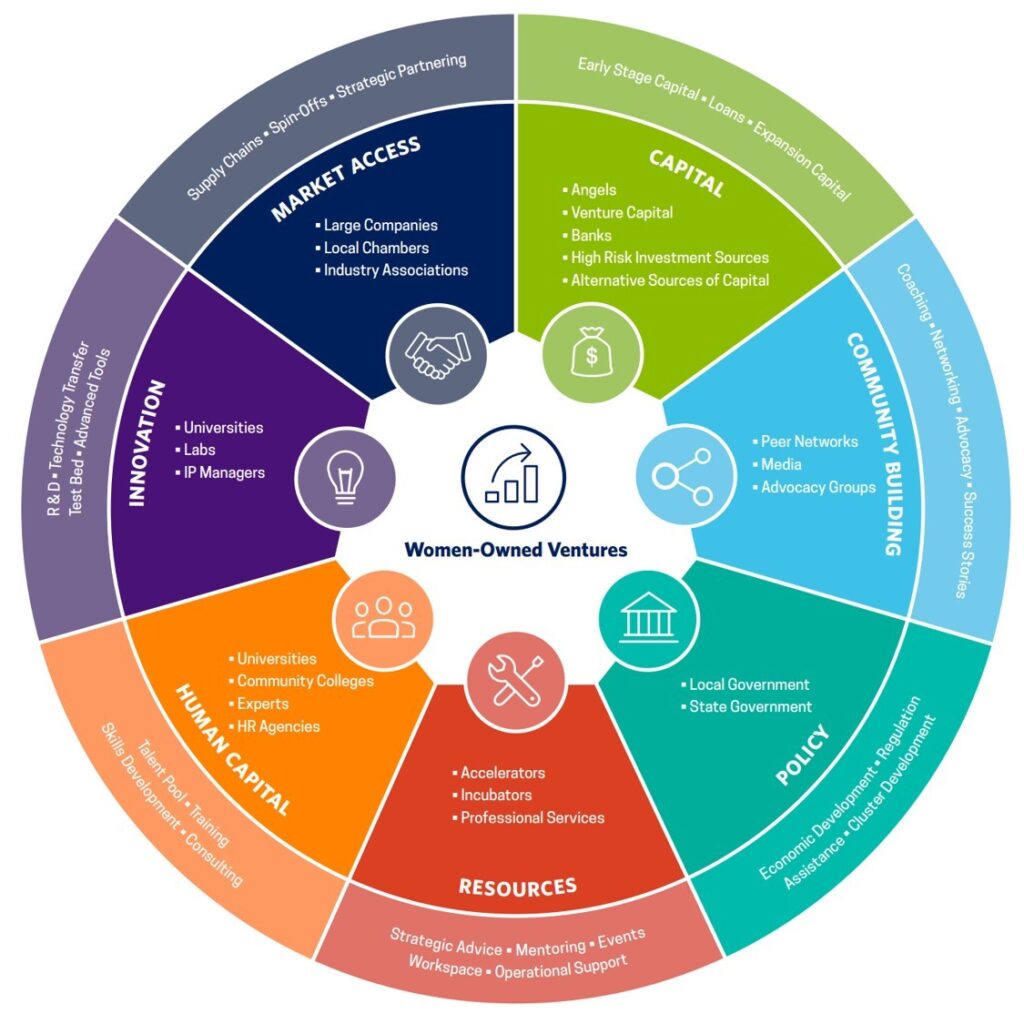
National Women’s Business Council Entrepreneurial Ecosystem Model
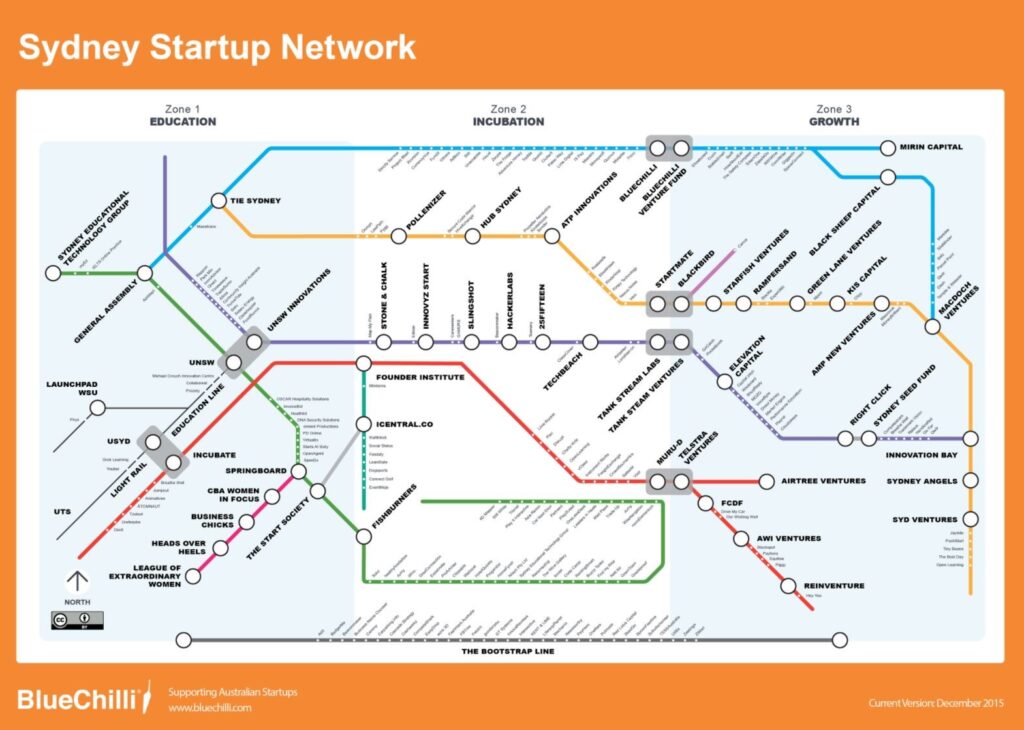
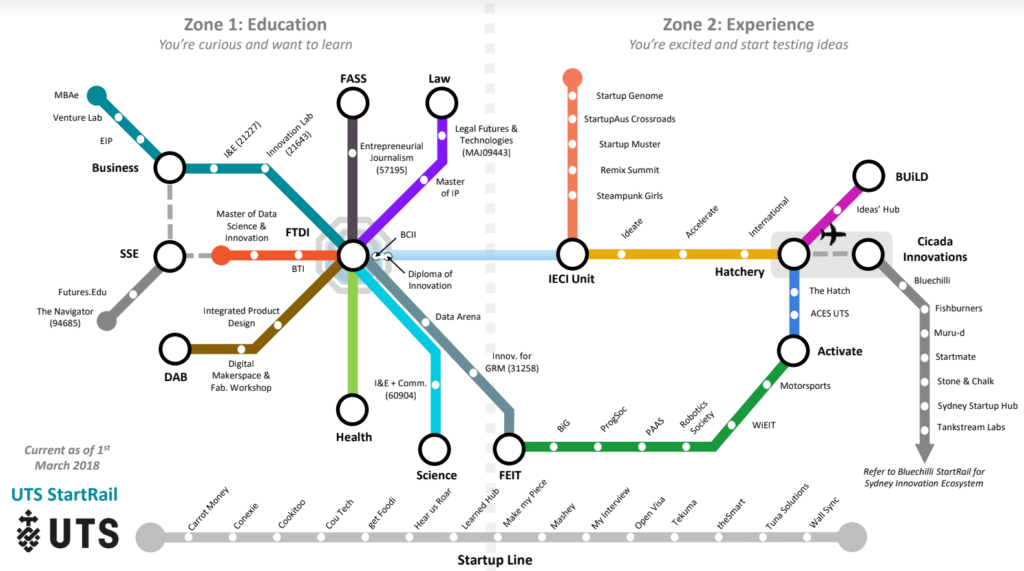
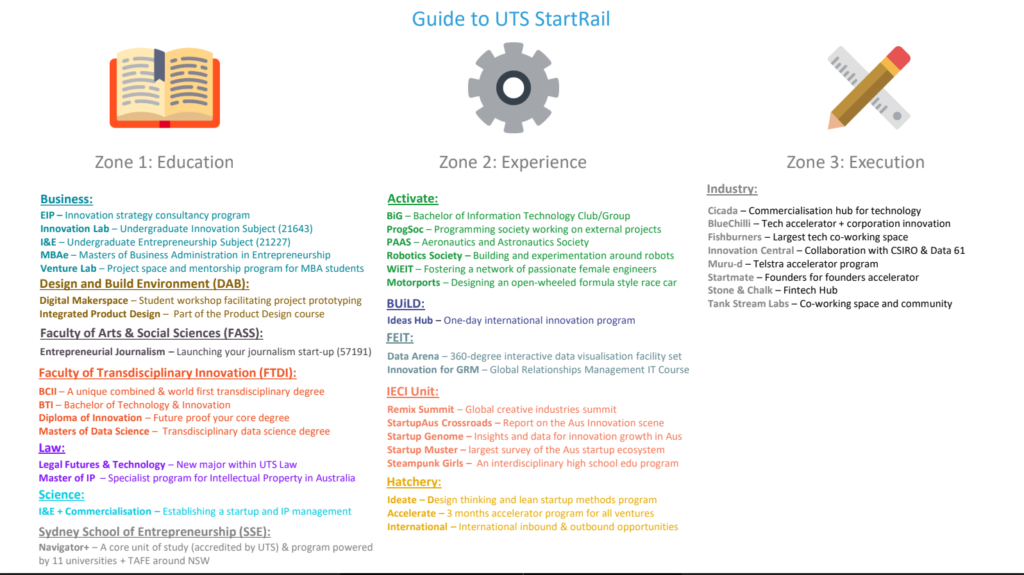
Startrail by Blue Chilli (Sydney and Melbourne)
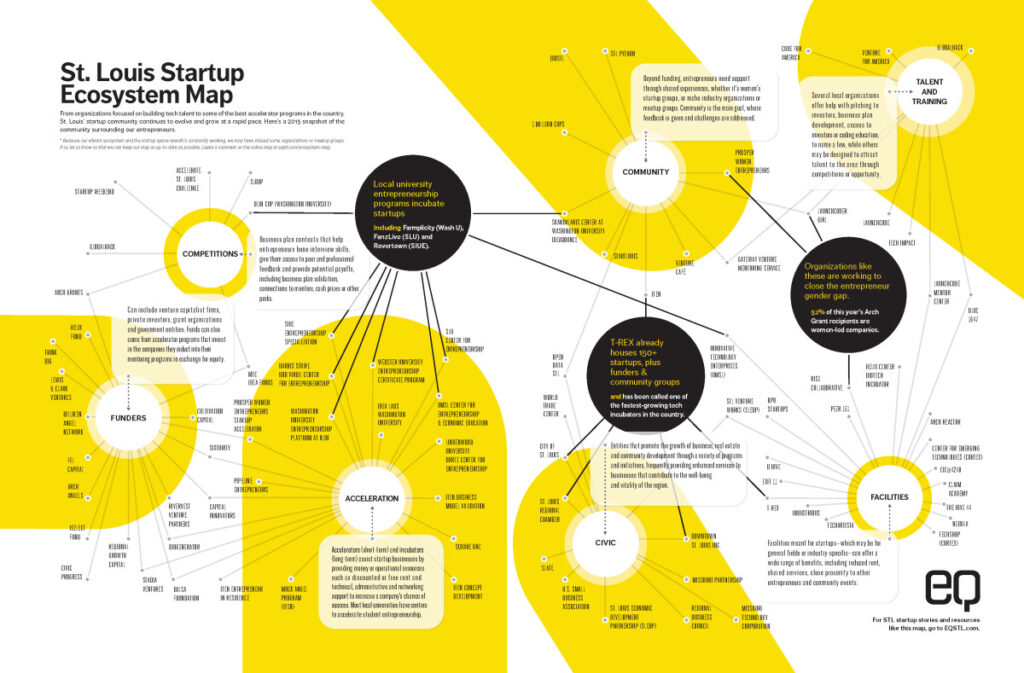
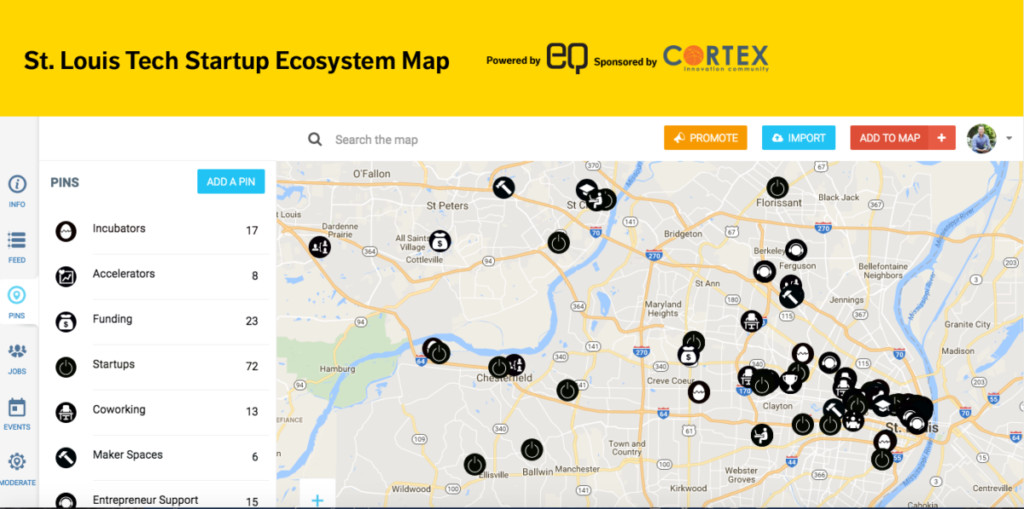
St Louis (graphic and interactive map)
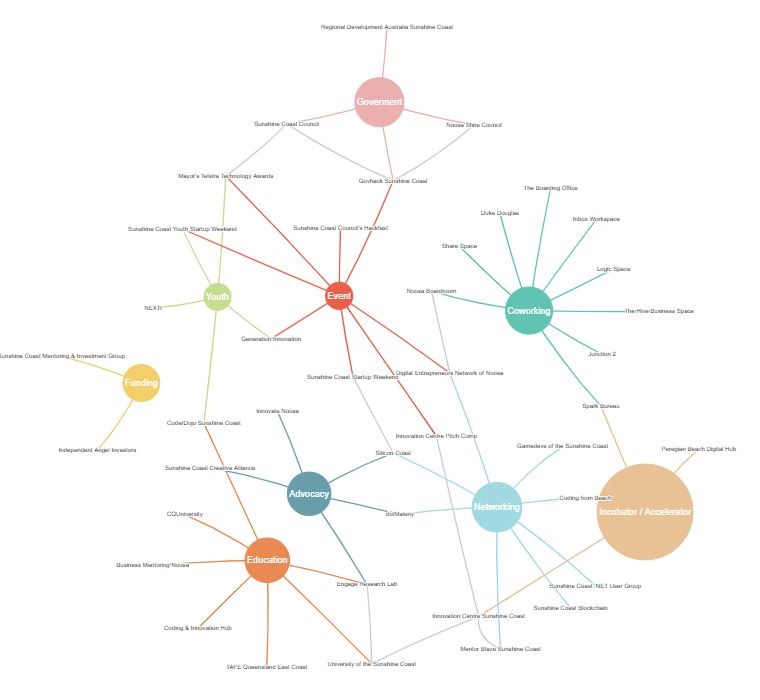
Sunshine Coast, Qld, AU
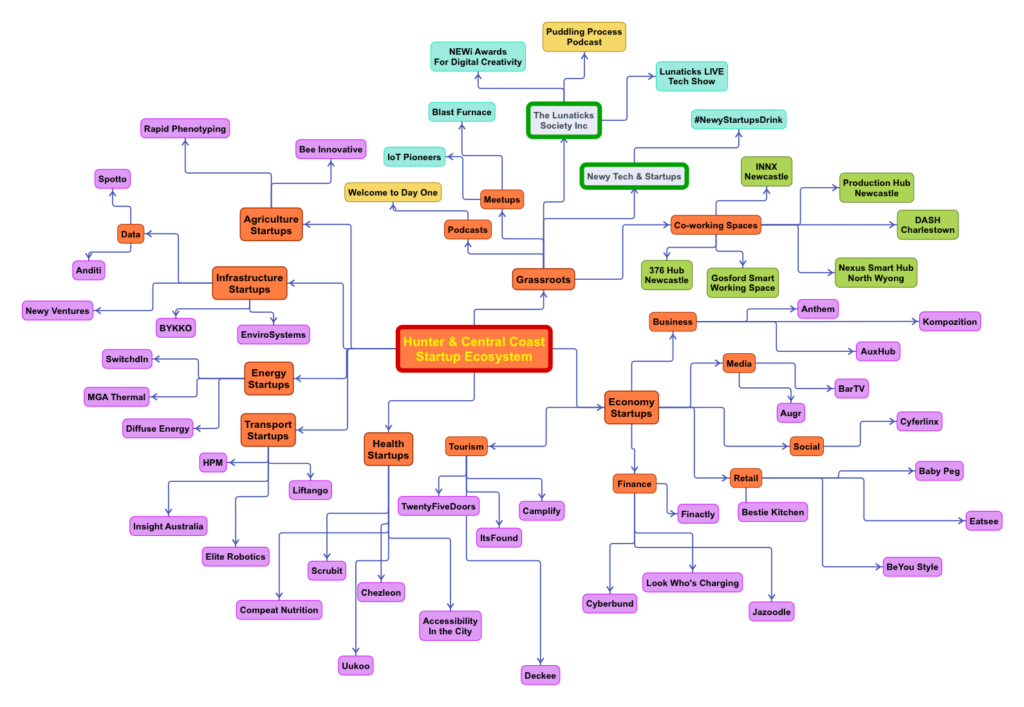
Hunter Valley, NSW, Australia
Add to the navigation conversation
Please comment if you have maps to add, are involved in a similar mapping process, to provide feedback, or would like to stay up to date with the progress.